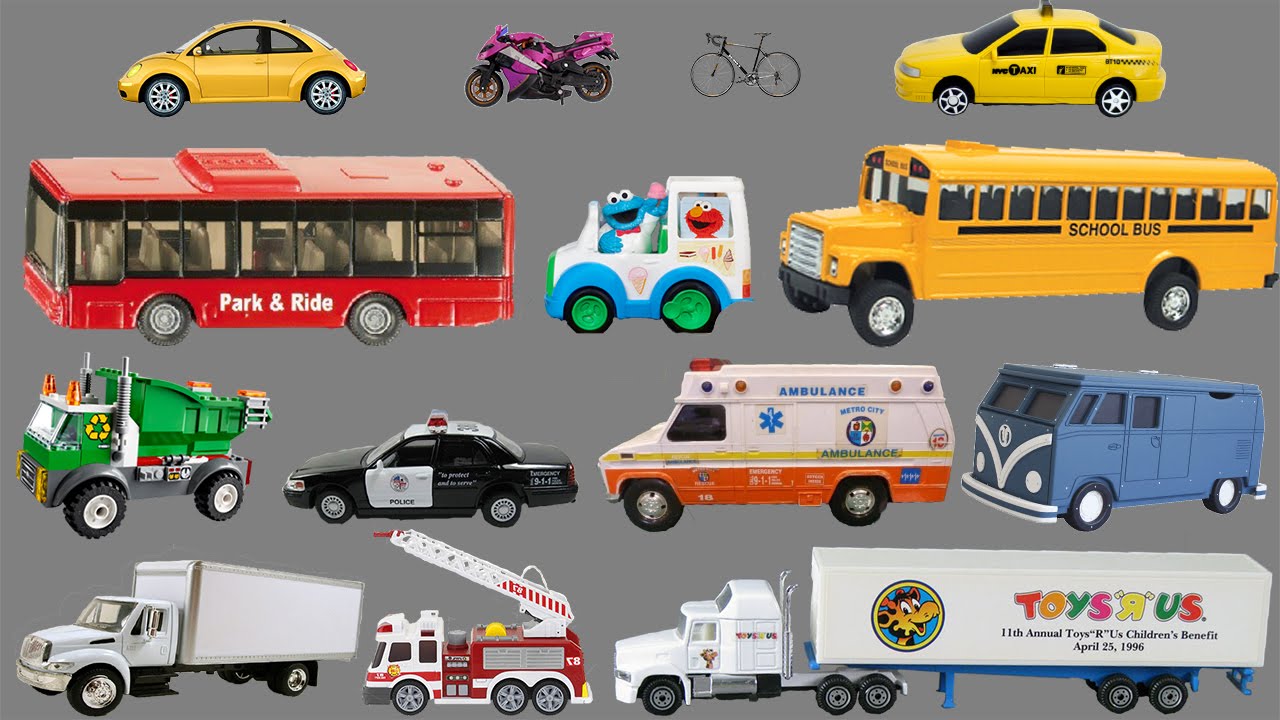
You walk to a parking lot and you see 34 wheels. What vehicles might you be seeing? Draw a picture with labels and use numbers to show me what the parking lot might look like.
|
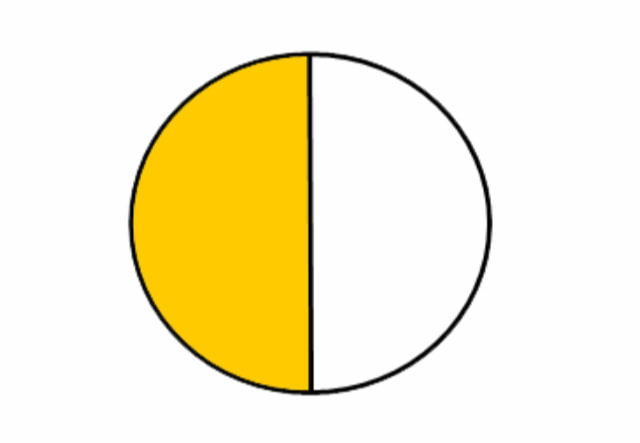
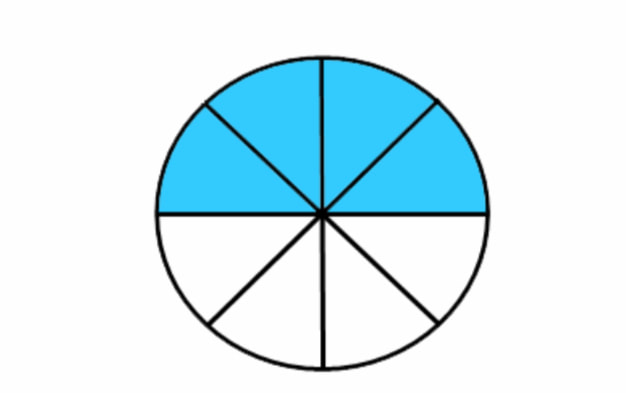
You walk to a parking lot and you see 34 wheels. What vehicles might you be seeing? Draw a picture with labels and use numbers to show me what the parking lot might look like. By the end of Grade One, students need to be able to read digital and analog clocks to the half-hour. Mrs. Anderson has 13 pairs of running shoes? How many running shoes would that be? (numbers, pictures, words)  We saw fourteen snakes. We saw nine green snakes and the rest were yellow. How many yellow snakes did we see? (Answer using numbers, pictures, and words).  Would you rather have one piece or 4 pieces? Why? Very briefly, these are the overall expectations for Grade One Mathematics in Ontario: Number Sense and Numeration: representing and ordering whole numbers to 50; establishing the conservation of number; representing money amounts to 20¢; decomposing and composing numbers to 20; establishing a one-to-one correspondence when counting the elements in a set; counting by 1’s, 2’s, 5’s, and 10’s; adding and subtracting numbers to 20 Measurement: measuring using non-standard units; telling time to the nearest half-hour; developing a sense of area; comparing objects using measurable attributes; comparing objects using non-standard units; investigating the relationship between the size of a unit and the number of units needed to measure the length of an object Geometry and Spatial Sense: sorting and classifying two-dimensional shapes and three-dimensional figures by attributes; recognizing symmetry; relating shapes to other shapes, to designs, and to figures; describing location using positional language Patterning and Algebra: creating and extending repeating patterns involving one attribute; introducing the concept of equality using only concrete materials Data Management and Probability: organizing objects into categories using one attribute; collecting and organizing categorical data; reading and displaying data using concrete graphs and pictographs; describing the likelihood that an event will occur This week in Khan Academy, we are having another look at Geometry, including the fractions of halves and quarters. Here's a quick look at Fractions, namely "equal parts" and "sharing equally". Yesterday we learned how to display data (information) using a picture graph or pictograph. Today we will see how to use a bar graph. Yesterday's video explained how to read and interpret the information in picture graphs. Today we will look at how to make a picture graph. In Khan Academy this week, we are looking at data management, namely picture graphs and bar graphs. This first video is a review of reading picture graphs and the concepts of "more than' and "fewer than". You do not need to do activities she shows you in the workbook at the end of the video. When you answer a word problem, you use numbers, pictures, and words ... BUT ... what if I gave you the picture? Could you ask me a math word problem question? What operation will it involve? (adding or subtracting?) 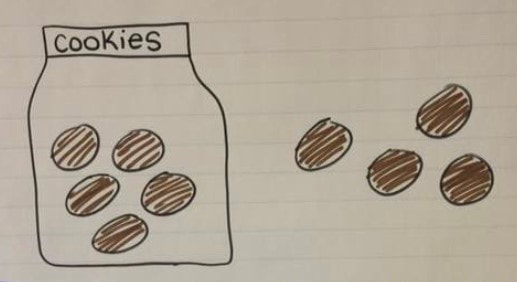 Go ahead and try! If your story is about cookies going into the jar, then you would be adding (+) and if the cookies are leaving the jar, then you would be subtracting (-). Your assignment: 1. Tell a story about what is happening to the cookies. 2. Now ask your question like "how many do you have left?" or "how many do you have all together?" 3. Solve the problem with numbers and words because you already have the picture. 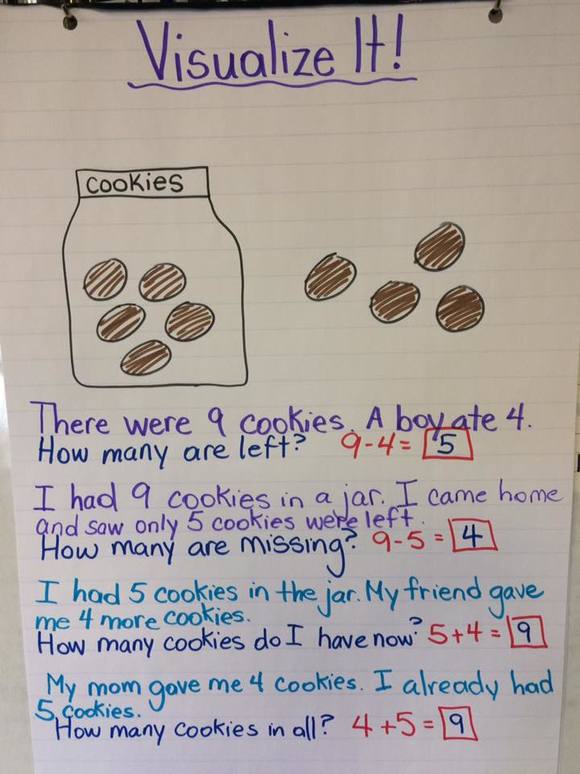 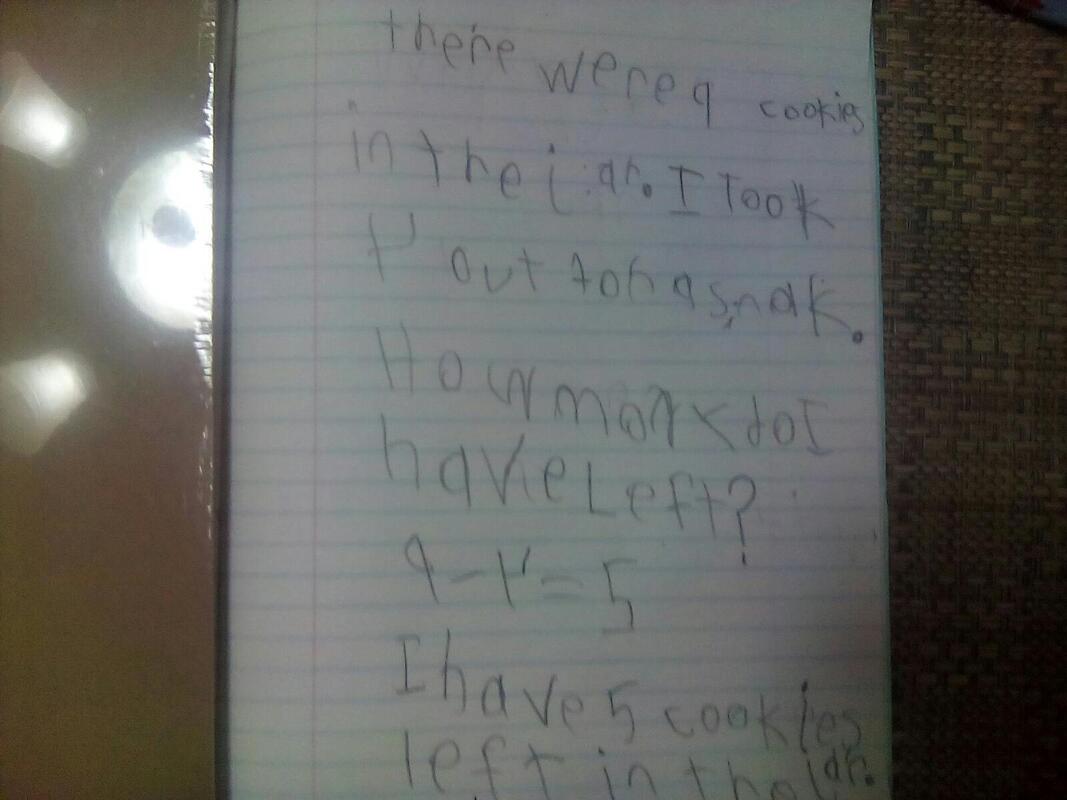 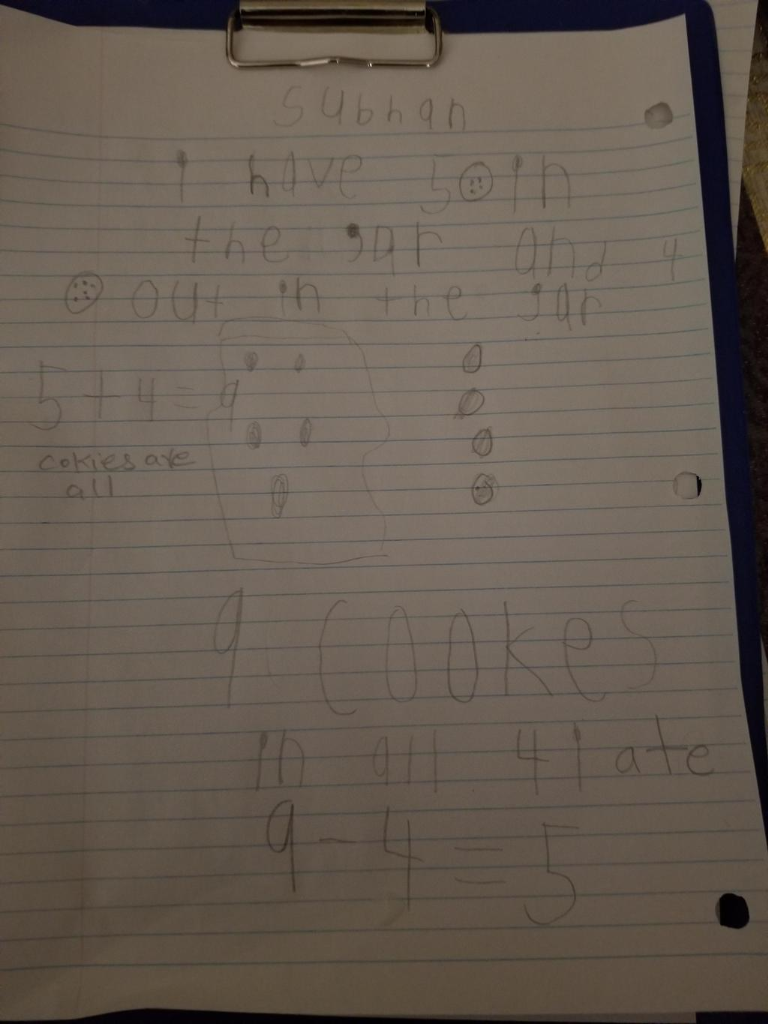 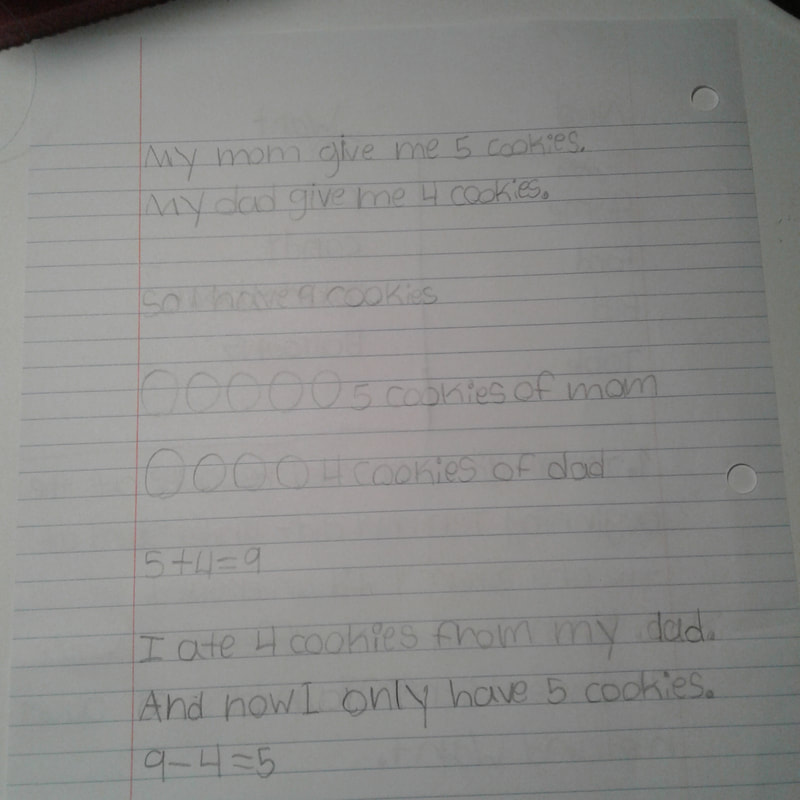 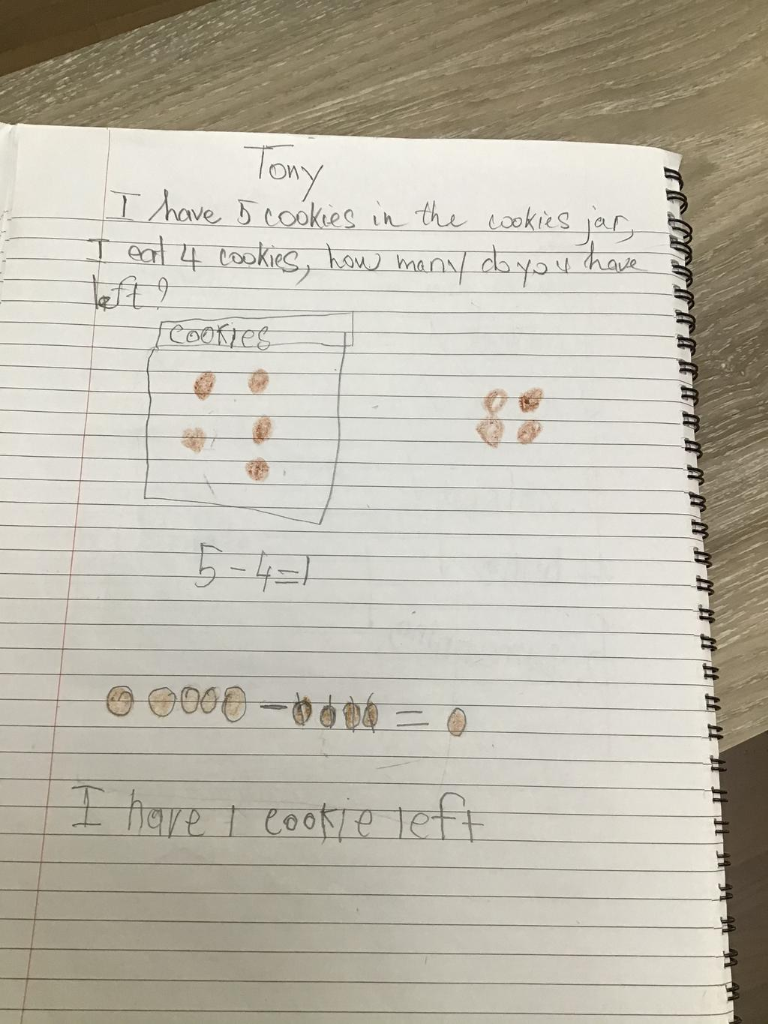  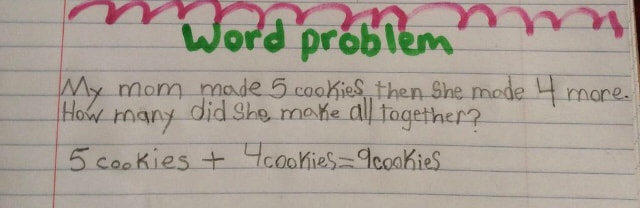 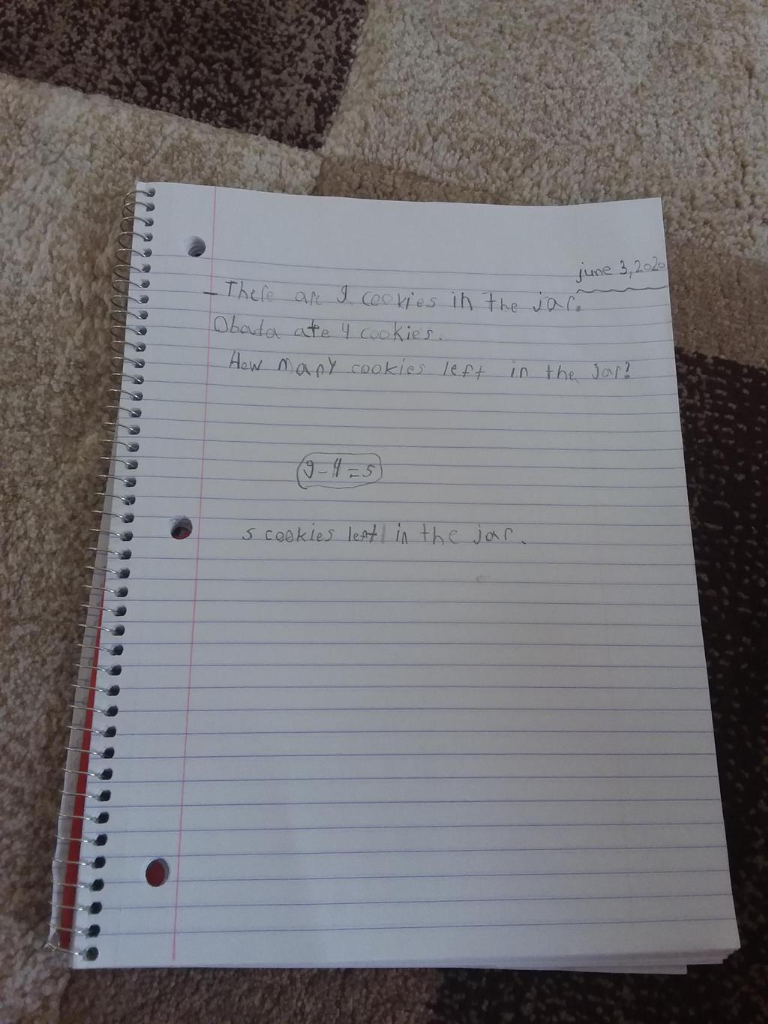 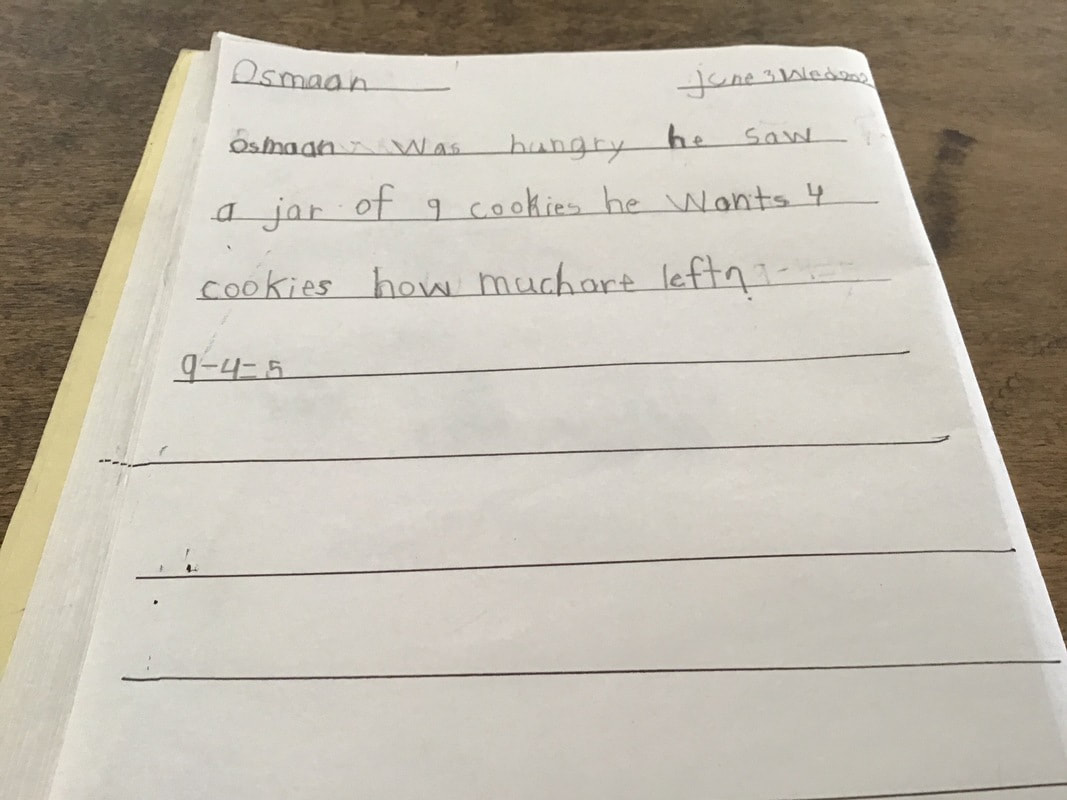 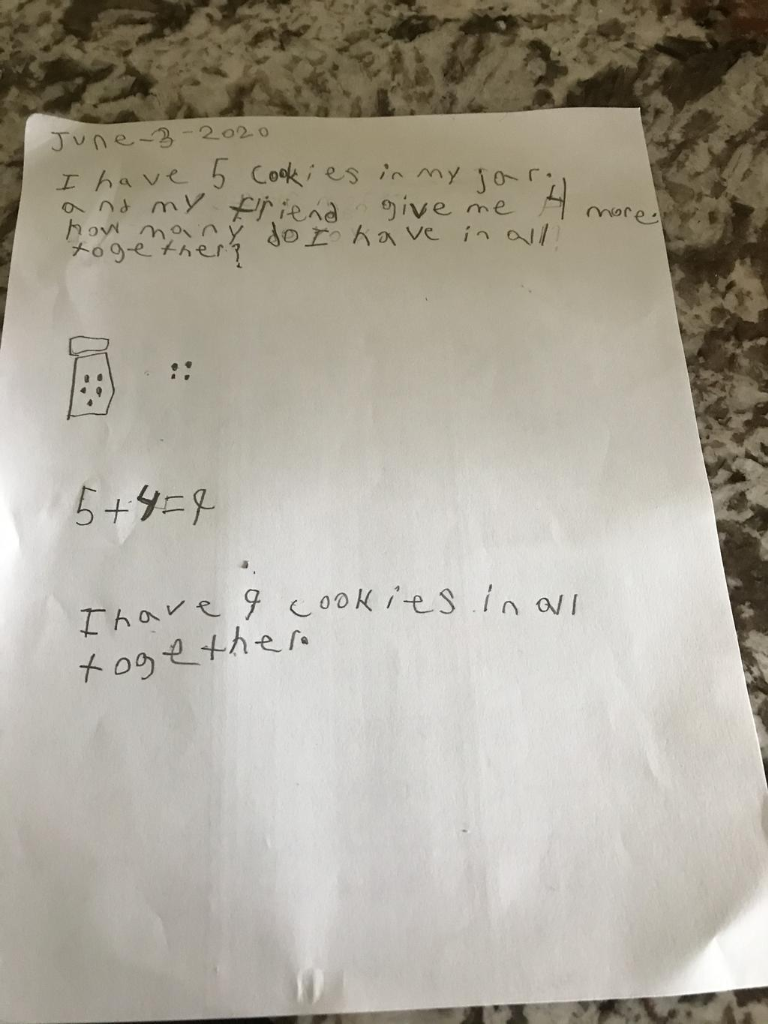 |
Archives
September 2022
|
 RSS Feed